Share


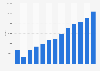
The United States Laboratory Spectroscopy Instruments market size was valued at approximately USD 950 million in 2025 and is projected to reach USD 1,480 million by 2035, growing at a CAGR of 4.6% during the forecast period. The market encompasses instruments used for separating and analyzing spectral data to identify materials and monitor chemical reactions. These include spectrometers, spectrographs, and spectrophotometers, serving primarily in research and industrial applications. Spectroscopy instruments are integral to pharmaceutical, biotechnology, and chemical industry operations, facilitating product development and quality control. Recent advancements have focused on higher precision, miniaturization, and integration with advanced data analytics tools. The market reflects a robust ecosystem characterized by technological innovation and the strategic presence of key manufacturers, R&D institutions, and their proprietary technologies.
This segment accounts for approximately 30% of the market. Its significance is supported by the diverse applications of spectroscopy instruments in diagnostics, research, and industrial analysis. The increasing adoption of advanced spectrometers is particularly notable.
Spectrometers - 40%: Central to material analysis and diagnostics.
Spectrographs - 35%: Essential for recording spectral characteristics.
Spectrophotometers - 25%: Widely used in quantifying analytes in solution.
| Product Type | Market Size (2025) | Market Share (2025) |
|---|---|---|
| Spectrometers | USD 380 million | 40% |
| Spectrographs | USD 333 million | 35% |
| Spectrophotometers | USD 238 million | 25% |
| Total | USD 950 million | 100% |
This segment holds 25% of the market, driven by laboratory and industrial demand. Research & Development laboratories are the leading contributors due to the high usage of spectroscopy for experimental analysis.
R&D Labs - 50%: Leading usage in experimental setups and material development.
Industrial Testing - 30%: Essential for process monitoring and validation.
Quality Control - 20%: Integral for ensuring industry standards and specifications.
| Application | Market Size (2025) | Market Share (2025) |
|---|---|---|
| R&D Labs | USD 237.5 million | 50% |
| Industrial Testing | USD 142.5 million | 30% |
| Quality Control | USD 95 million | 20% |
| Total | USD 475 million | 100% |
This category consists of 25% of the market, majorly propelled by mass spectrometry's precision in diverse scientific applications.
Mass Spectrometry - 45%: Key in detecting molecular compounds.
NMR Spectrometry - 30%: Crucial for molecular structure analysis.
Other Technologies - 25%: Complementary to various scientific studies.
| Technology | Market Size (2025) | Market Share (2025) |
|---|---|---|
| Mass Spectrometry | USD 213.75 million | 45% |
| NMR Spectrometry | USD 142.5 million | 30% |
| Other Technologies | USD 118.75 million | 25% |
| Total | USD 475 million | 100% |
This segment covers 20% of the market, with the pharmaceutical industry commanding the highest share due to rigorous testing requirements.
Pharmaceutical - 50%: Core contributor due to stringent quality standards.
Biotechnology - 30%: High reliance on advanced spectroscopic techniques.
Chemicals - 20%: Utility in compositional and material analysis.
| End-use Industry | Market Size (2025) | Market Share (2025) |
|---|---|---|
| Pharmaceutical | USD 95 million | 50% |
| Biotechnology | USD 57 million | 30% |
| Chemicals | USD 38 million | 20% |
| Total | USD 190 million | 100% |
| Impact Factor | Impact Level | Geographic Relevance | Impact Timeline |
|---|---|---|---|
| Increasing R&D Activities | High | United States | Short to Medium Term |
| Growth in Pharmaceutical Industry | High | United States | Medium Term |
| Technological Advances | Medium | United States | Long Term |
| Government Support for Scientific Research | Medium | United States | Medium Term |
| Increasing Automation in Laboratories | Medium | United States | Short Term |
Rapid advancements in spectroscopic techniques, particularly mass spectrometry, are enabling new possibilities for analytical accuracy and procedural efficiency, significantly impacting R&D intensification and laboratory automation initiatives.
The US Laboratory Spectroscopy Instruments market has evolved from traditional techniques to state-of-the-art digital spectroscopy, accommodating increasing demand for precise analytical instrumentation. Customer specifications emphasize real-time adaptability and results accuracy, driving innovations in instrument technology. The sector has experienced significant investment in infrastructure development and a shift to enhanced automation processes, promoting consolidation among key industry players. Entry barriers have notably decreased with the proliferation of diverse commercial applications, signaling ample growth prospects, particularly in pharmaceuticals and biotechnology.
Emerging technologies have revolutionized spectroscopy instruments, with advancements in artificial intelligence and cloud-based solutions improving data interpretation and remote access capabilities. Recent innovations include handheld spectrometers and automated systems integrating IoT devices and machine learning algorithms, aligning with the growing emphasis on high-throughput analysis and operational efficiency.
The value chain incorporates raw material suppliers, specialized component manufacturers, and advanced technology providers who interface with instrument developers. This structured supply chain ensures precise component availability but is susceptible to fluctuations affecting procurement and operational costs. Sustainable profitability depends on optimizing logistical efficiencies and minimizing volatility impacts across production cycles.
In the USA, rigorous standards prevail with regulatory bodies like the FDA ensuring compliance with high safety and precision standards. The market adheres to stringent guidelines in analytical procedures, affecting both domestic production and importation strategies, while initiatives in regulatory harmonization support industry innovation and competitive positioning.
The competitive landscape is characterized by formidable participants specializing in comprehensive spectroscopy solutions tailored to diverse industrial needs. Key players are boosting their market presence through strategic collaborations, technological acquisitions, and expanding research facilities. Product differentiation is primarily achieved via enhanced accuracy and integration capabilities in real-time analytical technologies, with companies pursuing expansive distribution networks to consolidate market positioning.
The US market is driven by significant demand from the Northeast region, a hub for pharmaceutical and biotechnology research. The Midwest supports industrial applications with established manufacturing facilities. The California corridor in the West provides innovation-centric advantages, promoting advanced R&D activities shown through recent adoption patterns. These regions offer opportunities for new market entrants and existing players to expand infrastructure effectively.
| State / Province / Subnational Region | Market Size (2025) | Market Share (2025) |
|---|---|---|
| Northeast | USD 380 million | 40% |
| Midwest | USD 238 million | 25% |
| West | USD 190 million | 20% |
| South | USD 142 million | 15% |
| Total | USD 950 million | 100% |
Applying Porter's Five Forces reveals moderate competitive rivalry with high buyer power stemming from specialized applications. Strategic entry considerations are bolstered by robust R&D investments, through which firms can leverage technological capabilities to optimize product portfolios and enhance supply chain resilience. Upcoming geographic expansion into industrial clusters presents lucrative entry points, especially for firms capitalizing on existing technological advancements and addressing emergent end-user segments.
Over the next 5-10 years, the US Laboratory Spectroscopy Instruments market is poised for growth, driven by advancements in precision technologies, regulatory support, and increased investment in R&D infrastructure. Mass spectrometry will remain the most promising segment, with geographic opportunities most pronounced in industrialized Northeast and innovative California. Market participants should prioritize expanding capacity and forming strategic partnerships to leverage competitive advantages, while addressing key risks related to regulatory compliance and price pressures.
Source:
To get full access to our Market Insights, you need a Professional Account or a Business Suite.


You will receive an email from our Business Development Manager. Please be sure to check your SPAM/JUNK folder too.
You will receive an email from our Business Development Manager. Please be sure to check your SPAM/JUNK folder too.
Our customers work more efficiently and benefit from