Share


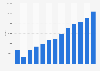
The US Laboratory High Precision Electronic Balance market size was valued at approximately USD 380 million in 2025 and is projected to reach USD 510 million by 2035, growing at a CAGR of 3.0% during the forecast period. The market encompasses high precision electronic balances used predominantly for laboratory and industrial applications. The products included are analytical balances, precision balances, and micro balances, utilized across sectors such as pharmaceuticals, chemicals, and food & beverages. Core applications involve research laboratories, industrial settings, and educational institutions. The industry ecosystem is characterized by major stakeholders, including manufacturers, distributors, and technology providers.
Historically, the market has evolved with technological advancements enhancing precision and accuracy, meeting the growing demand for reliable laboratory instruments. Key recent developments include the integration of digital technologies and automated features within electronic balances, enhancing user interface, and data accuracy. The strategic importance of the market is underscored by its application in critical industries demanding high precision measurements, with a positive outlook driven by continuous innovations and increasing application scope.
This segment accounts for approximately 35% of the market. Its significance is driven by varying product demand across analytical, precision, and micro balances, each meeting specific precision requirements in different industrial and laboratory settings.
Analytical Balances - 50%: The demand for high accuracy in laboratory settings boosts its market share.
Precision Balances - 30%: Preferred in industrial applications for standard precision needs.
Micro Balances - 20%: Needed for ultra-precise measurements, mainly in specialized research.
| Product Type | Market Size (2025) | Market Share (2025) |
|---|---|---|
| Analytical Balances | USD 190 million | 50% |
| Precision Balances | USD 114 million | 30% |
| Micro Balances | USD 76 million | 20% |
| Total | USD 380 million | 100% |
This segment accounts for approximately 30% of the market, catering to diverse demand patterns across research laboratories, industrial applications, and educational settings, where accuracy and precision are critical.
Research Laboratories - 45%: Dominates due to extensive use in R&D for precision measurements.
Industrial - 35%: Growth driven by applications in manufacturing and quality control settings.
Educational - 20%: Used in academic institutions for student training and experiments.
| Application | Market Size (2025) | Market Share (2025) |
|---|---|---|
| Research Laboratories | USD 171 million | 45% |
| Industrial | USD 133 million | 35% |
| Educational | USD 76 million | 20% |
| Total | USD 380 million | 100% |
This segment holds about 25% of the market, characterized by its application across various industries, each requiring significantly different precision levels and capacities.
Pharmaceuticals - 40%: Critical for formulation and quality control processes.
Chemical - 30%: Utilized in process monitoring and quality assurance.
Food & Beverages - 30%: Ensuring compliance with quality standards and specifications.
| End-use Industry | Market Size (2025) | Market Share (2025) |
|---|---|---|
| Pharmaceuticals | USD 152 million | 40% |
| Chemical | USD 114 million | 30% |
| Food & Beverages | USD 114 million | 30% |
| Total | USD 380 million | 100% |
This category includes digital and analog technologies, representing around 10% of the market, with digital technologies rapidly gaining ground due to increased precision and ease of data integration.
Digital - 70%: Largely dominating due to technological advancements and reliability.
Analog - 30%: Still in use for basic applications not requiring high precision.
| Technology | Market Size (2025) | Market Share (2025) |
|---|---|---|
| Digital | USD 266 million | 70% |
| Analog | USD 114 million | 30% |
| Total | USD 380 million | 100% |
| Impact Factor | (~) % Impact on CAGR Forecast | Geographic Relevance | Impact Timeline |
|---|---|---|---|
| Technological Advancements | +0.7% | United States | Medium Term (2-4 Years) |
| Increasing R&D Investments | +0.6% | United States | Short to Medium Term |
| Higher Industry Standards | +0.5% | United States | Medium to Long Term |
| Expanding Industrial Applications | +0.4% | United States | Short Term (<=2 Years) |
The primary drivers include technological advancements that are enhancing measurement precision and expanding industrial applications, indicating robust future demand and business opportunities in new segments.
The market has experienced steady growth driven by heightened demand for precision in measurement across various industries. Current dynamics show a shift towards more advanced digital technologies fulfilling stringent regulation and quality requirements, with increasing R&D investments and manufacturing expansions contributing to supply-side capacity enhancement. Opportunities exist in enhancing manufacturing processes, launching innovative product lines, and exploring unmet needs in emerging application areas, notwithstanding supply chain complexities and consolidation trends across key players seeking competitive advantages through M&A and partnerships.
New technologies, such as embedded digital sensors, automation, and connectivity enhancements, are at the forefront of market transformation. Developments in AI-powered analytics offer unprecedented accuracy and efficiency gains. Companies are focusing on R&D to bring about innovative solutions aimed at reducing human error and increasing precision in demanding applications. Digital integration is unlocking new commercial applications, sharpening competitive edges, and opening future-oriented innovation opportunities.
The value chain comprises raw material suppliers, component manufacturers, electronic balance producers, and a network of distributors and service partners targeting end users across industries. Profitability hinges on reducing manufacturing costs, optimizing procurement, and managing supply chain risks. Efficient logistics, competitive pricing, and maintaining high production capacity are central to securing market advantage, with opportunities for cost savings through digital-driven process improvements throughout production stages.
Regulations imposed by governmental bodies ensure product reliability, safety, and compliance with industry standards such as ISO and ASTM specifications. Regulatory measures also extend to environmental considerations and import-export policies impacting technology deployment and competition. While incentives for innovation are present, unpredictable policy changes may pose challenges. Firms must closely adhere to quality certifications while navigating regulatory landscapes to secure sustainable growth amidst competitive pressures.
The market features a competitive structure with numerous players vying for dominance, where leading manufacturers showcase significant technology capabilities and product differentiation. Companies like Sartorius and Mettler Toledo maintain robust geographic reach through widespread distribution networks, focusing strategically on partnerships, innovations, and capacity enhancements to achieve market leverage. Innovations, strategic acquisitions, and partnerships underpin competitive strategies, enabling diversification, product portfolio expansion, and market-capture strategies executed by key players to consolidate their market standings and grasp emergent opportunities.
The US constitutes a significant market for laboratory high precision electronic balances, driven by thriving pharmaceutical and biotechnology sectors, boasting high R&D investments and strong technological infra-structure. The Northeast, as an industrial and academic hub, leads demand, facilitated by strategic manufacturing establishments and innovation centers. The Midwest displays growing industrial applications, while the South and West show notable investment trends in expanding production and consumption base. State-level variations in regulations impact market competitiveness and adoption rates, with opportunities arising from policy incentives and regional collaborations fostering innovation and technology transfer.
| State / Province / Subnational Region | Market Size (2025) | Market Share (2025) |
|---|---|---|
| Northeast | USD 114 million | 30% |
| Midwest | USD 76 million | 20% |
| South | USD 95 million | 25% |
| West | USD 95 million | 25% |
| Total | USD 380 million | 100% |
Applying strategic frameworks such as Porter’s Five Forces reveals moderate competitive rivalry, driven by technological differentiation and quality standards compliance. Market entry potential exists through strategic alliances and local partnerships, optimizing product portfolios to address unmet needs. Diversifying supply chains enhances resilience, while investing in technology and developing customer-centric solutions can secure competitive advantage. Moreover, internal value chain efficiencies and automation provide cost control opportunities, ensuring high-margin business sustainability and long-term growth impacts.
Over the next 5-10 years, the US Laboratory High Precision Electronic Balance market is poised for moderate to robust growth, orchestrated by advancements in digital technologies and rising demand within high-stake sectors like pharmaceuticals and biotechnology. The most promising opportunities lie in expanding industrial applications and pioneering innovation in precision measurement technologies. However, challenges such as regulatory compliance, supply chain volatilities, and intense competition require strategic foresight. Companies should prioritize technology investments, expand geographic presence, and diversify offerings to capture emerging market opportunities and secure long-term sustainability.
Source:
To get full access to our Market Insights, you need a Professional Account or a Business Suite.


You will receive an email from our Business Development Manager. Please be sure to check your SPAM/JUNK folder too.
You will receive an email from our Business Development Manager. Please be sure to check your SPAM/JUNK folder too.
Our customers work more efficiently and benefit from