By clicking “Accept All Cookies” you agree to the storing of cookies on your device to enhance site navigation, analyze site usage, and assist in our marketing efforts.
Privacy PolicyGlobal Grain Polishing Machine Market (By Type: Processing Capacity below 5 tons per hour, Processing Capacity above 5 tons per hour; By Application: Factory, Home Workshop; By Region: North America, Europe, Asia-Pacific, Latin America, Middle East and Africa) Industry Size, Share, Growth, Trends 2025 to 2034.
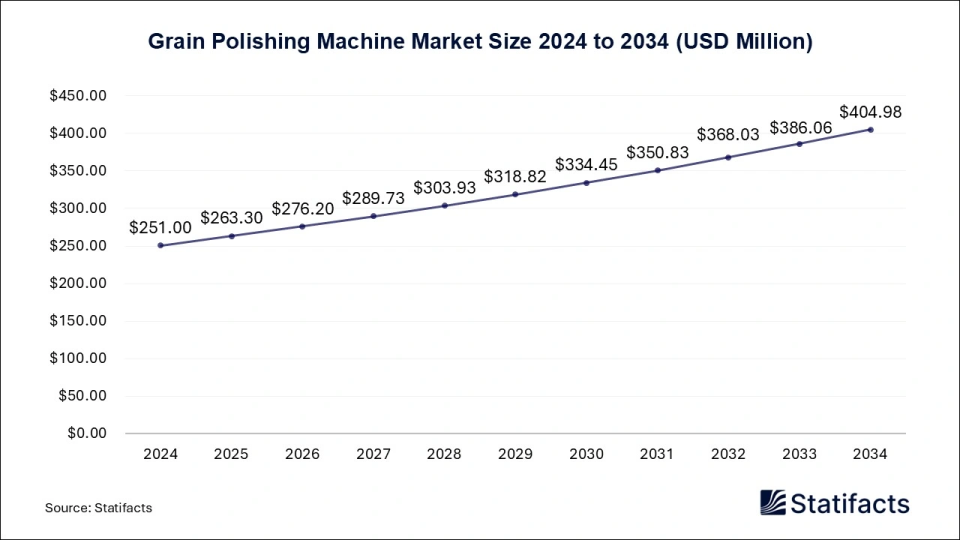
The global grain polishing machine market, valued at USD 251 million in 2024, is projected to reach USD 404.98 million by 2034, growing at a CAGR of 4.9% driven by rising grain quality standards and demand for advanced milling equipment.
| Reports Attributes | Statistics |
| Market Size in 2024 | USD 88.05 Million |
| Market Size in 2025 | USD 2.54 Million |
| Market Size in 2031 | USD 124.72 Million |
| Market Size by 2034 | USD 144.8 Million |
| CAGR 2025 to 2034 | 5.1% |
| Base Year | 2024 |
| Forecast Period | 2025 to 2034 |
The grain polishing machine market is growing at a significant pace due to increasing consumer awareness of high-quality grains, including rice, wheat, and cereals. As a result, the agriculture sector is also focusing on investing in modern equipment that manages its tasks with minimal human effort and intervention. However, the agricultural sector in rural areas may face challenges in adopting such equipment due to higher investment requirements. Growing economies in the African and Asian countries are expected to generate more business in the future.
The grain polishing machine market is expected to witness rapid growth due to the integration of artificial intelligence and machine learning. AI is being used to optimize the polishing levels in the machine that manages the grain wastage. ML models also adopt working patterns and make necessary changes without manual intervention.
| Regions | Shares (%) |
| North America | 18% |
| Asia Pacific | 46% |
| Europe | 22% |
| Latin America | 8% |
| Middle East & Africa | 6% |
| Segments | Shares (%) |
| Processing Capacity below 5 tons per hour | 58% |
| Processing Capacity above 5 tons per hour | 42% |
| Segments | Shares (%) |
| Factory | 78% |
| Home Workshop | 22% |
Published by Kesiya Chacko
| Type | 2024 | 2025 | 2026 | 2027 | 2028 | 2029 | 2030 | 2031 | 2032 | 2033 | 2034 |
|---|---|---|---|---|---|---|---|---|---|---|---|
| Processing Capacity below 5 tons per hour | 145.58 | 151.13 | 156.88 | 162.83 | 168.99 | 175.35 | 181.94 | 188.75 | 195.79 | 203.07 | 210.59 |
| Processing Capacity above 5 tons per hour | 105.42 | 112.17 | 119.32 | 126.90 | 134.94 | 143.47 | 152.51 | 162.08 | 172.24 | 182.99 | 194.39 |
| Application | 2024 | 2025 | 2026 | 2027 | 2028 | 2029 | 2030 | 2031 | 2032 | 2033 | 2034 |
|---|---|---|---|---|---|---|---|---|---|---|---|
| Factory | 195.78 | 206.16 | 217.09 | 228.60 | 240.71 | 253.47 | 266.89 | 281.02 | 295.89 | 311.55 | 328.03 |
| Home Workshop | 55.22 | 57.14 | 59.11 | 61.13 | 63.22 | 65.35 | 67.56 | 69.81 | 72.14 | 74.51 | 76.95 |
| Region | 2024 | 2025 | 2026 | 2027 | 2028 | 2029 | 2030 | 2031 | 2032 | 2033 | 2034 |
|---|---|---|---|---|---|---|---|---|---|---|---|
| North America | 45.18 | 47.13 | 49.16 | 51.28 | 53.49 | 55.79 | 58.19 | 60.69 | 63.30 | 66.02 | 68.85 |
| Europe | 55.22 | 57.66 | 60.21 | 62.87 | 65.65 | 68.55 | 71.57 | 74.73 | 78.02 | 81.46 | 85.04 |
| Asia-Pacific | 115.46 | 121.64 | 128.16 | 135.02 | 142.24 | 149.85 | 157.86 | 166.30 | 175.18 | 184.54 | 194.39 |
| Latin America | 20.08 | 21.06 | 22.10 | 23.18 | 24.31 | 25.51 | 26.76 | 28.07 | 29.44 | 30.88 | 32.40 |
| Middle East and Africa | 15.06 | 15.81 | 16.57 | 17.38 | 18.24 | 19.12 | 20.07 | 21.04 | 22.09 | 23.16 | 24.30 |
| Subsegment | 2024 | 2025 | 2026 | 2027 | 2028 | 2029 | 2030 | 2031 | 2032 | 2033 | 2034 |
|---|---|---|---|---|---|---|---|---|---|---|---|
| Processing Capacity below 5 tons per hour | 145.58 | 151.13 | 156.88 | 162.83 | 168.99 | 175.35 | 181.94 | 188.75 | 195.79 | 203.07 | 210.59 |
| Processing Capacity above 5 tons per hour | 105.42 | 112.17 | 119.32 | 126.90 | 134.94 | 143.47 | 152.51 | 162.08 | 172.24 | 182.99 | 194.39 |
| Subsegment | 2024 | 2025 | 2026 | 2027 | 2028 | 2029 | 2030 | 2031 | 2032 | 2033 | 2034 |
|---|---|---|---|---|---|---|---|---|---|---|---|
| Factory | 195.78 | 206.16 | 217.09 | 228.60 | 240.71 | 253.47 | 266.89 | 281.02 | 295.89 | 311.55 | 328.03 |
| Home Workshop | 55.22 | 57.14 | 59.11 | 61.13 | 63.22 | 65.35 | 67.56 | 69.81 | 72.14 | 74.51 | 76.95 |
| Subsegment | 2024 | 2025 | 2026 | 2027 | 2028 | 2029 | 2030 | 2031 | 2032 | 2033 | 2034 |
|---|---|---|---|---|---|---|---|---|---|---|---|
| North America | 45.18 | 47.13 | 49.16 | 51.28 | 53.49 | 55.79 | 58.19 | 60.69 | 63.30 | 66.02 | 68.85 |
| Europe | 55.22 | 57.66 | 60.21 | 62.87 | 65.65 | 68.55 | 71.57 | 74.73 | 78.02 | 81.46 | 85.04 |
| Asia-Pacific | 115.46 | 121.64 | 128.16 | 135.02 | 142.24 | 149.85 | 157.86 | 166.30 | 175.18 | 184.54 | 194.39 |
| Latin America | 20.08 | 21.06 | 22.10 | 23.18 | 24.31 | 25.51 | 26.76 | 28.07 | 29.44 | 30.88 | 32.40 |
| Middle East and Africa | 15.06 | 15.81 | 16.57 | 17.38 | 18.24 | 19.12 | 20.07 | 21.04 | 22.09 | 23.16 | 24.30 |
Related Reports
To get full access to our Market Insights, you need a Professional Account or a Business Suite.

You will receive an email from our Business Development Manager. Please be sure to check your SPAM/JUNK folder too.

You will receive an email from our Business Development Manager. Please be sure to check your SPAM/JUNK folder too.

Our customers work more efficiently and benefit from


