By clicking “Accept All Cookies” you agree to the storing of cookies on your device to enhance site navigation, analyze site usage, and assist in our marketing efforts.
Privacy PolicyExcess Inventory Solutions Market (By Type: Preventive Solutions and Post-event Solutions; By Application: Electronics, Fast Moving Consumer Goods, Auto Parts, and Others; By Region: North America, Europe, Asia Pacific, and LAMEA) Industry Size, Share, Growth, Trends 2025 to 2034
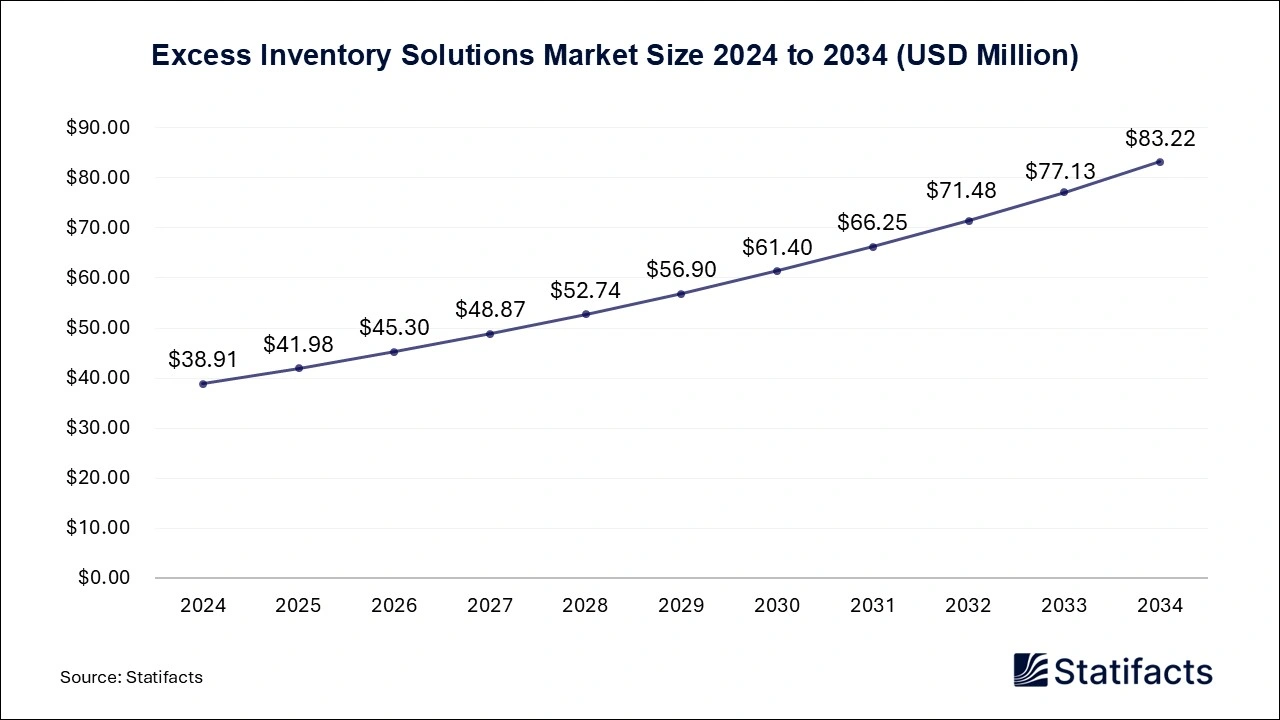
The global excess inventory solutions market size was valued at USD 38.91 million in 2024, is projected to reach approximately USD 83.22 million by 2034. This growth, fueled by the rising need for efficient inventory management and supply chain optimization, is expected at a CAGR of 7.9%.

| Reports Attributes | Statistics |
| Market Size in 2024 | USD 38.91 Million |
| Market Size in 2025 | USD 41.98 Million |
| Market Size in 2031 | USD 66.25 Million |
| Market Size by 2034 | USD 83.22 Million |
| CAGR 2025 to 2034 | 7.9% |
| Base Year | 2024 |
| Forecast Period | 2025 to 2034 |
The development of service-based models and technology-driven platforms that manage the inventory lifecycle more efficiently is driving strong growth in the excess inventory solutions market. Companies across industries are recognizing the importance of efficient asset recovery and inventory optimization as global supply chains become increasingly complex. Disruptions in logistics networks, coupled with the rising volume of e-commerce returns and escalating warehousing costs, are pushing organizations to adopt advanced strategies for surplus inventory management. These systems are designed not only to free up capital tied up in unsold goods but also to reduce environmental waste by improving the reuse and redistribution of excess assets.
The global shift toward sustainability and resource efficiency has also intensified regulatory attention on circular economy practices. Policymakers are encouraging businesses to extend product life cycles and reduce landfill waste through refurbishment, recycling, and reallocation initiatives. As a result, companies are increasingly seeking digital solutions that can provide real-time visibility of inventory levels, automate redistribution, and track environmental performance. However, market adoption is not without challenges. The presence of variable residual values, multi-channel obsolescence risks, and logistical coordination issues often makes it difficult for organizations to quickly implement standardized inventory recovery systems. These complexities are particularly evident in sectors with fast-changing demand cycles, such as consumer electronics and fashion.
Artificial intelligence is emerging as one of the most powerful tools reshaping the landscape of excess inventory solutions. The integration of AI enables predictive analytics that can forecast demand shifts, detect early signs of product obsolescence, and suggest optimal liquidation strategies. Machine learning models enhance decision-making by analyzing data on inventory aging, channel performance, and customer purchasing trends. This analytical capability enables businesses to make faster, more accurate redeployment decisions, ensuring that assets are directed to the most profitable or sustainable use.
Service providers in the market are adopting automated dashboards and AI-based orchestration systems that consolidate data from multiple sources and enable dynamic inventory control. These platforms reduce manual intervention, accelerate the disposal and resale cycle, and improve asset recovery ratios. They also provide valuable insights into sustainability metrics, allowing organizations to track carbon savings and material reuse. The combination of predictive intelligence, automation, and circular economy principles is positioning AI-driven excess inventory management as a key differentiator in a market defined by volatility, efficiency demands, and sustainability goals.
| Regions | Shares (%) |
| North America | 28% |
| Asia Pacific | 35% |
| Europe | 25% |
| LAMEA | 12% |
| Segments | Shares (%) |
| Preventive Solutions | 55% |
| Post-event Solutions | 45% |
| Segments | Shares (%) |
| Electronics | 35% |
| Fast Moving Consumer Goods | 30% |
| Auto Parts | 20% |
| Others | 15% |
Published by Yogesh Kulkarni
| Type | 2024 | 2025 | 2026 | 2027 | 2028 | 2029 | 2030 | 2031 | 2032 | 2033 | 2034 |
|---|---|---|---|---|---|---|---|---|---|---|---|
| Preventive Solutions | 21.40 | 22.31 | 23.26 | 24.26 | 25.29 | 26.36 | 27.48 | 28.65 | 29.87 | 31.13 | 32.45 |
| Post-event Solutions | 17.51 | 18.04 | 18.58 | 19.14 | 19.71 | 20.30 | 20.90 | 21.53 | 22.17 | 22.83 | 23.50 |
| Application | 2024 | 2025 | 2026 | 2027 | 2028 | 2029 | 2030 | 2031 | 2032 | 2033 | 2034 |
|---|---|---|---|---|---|---|---|---|---|---|---|
| Electronics | 13.62 | 14.04 | 14.48 | 14.93 | 15.39 | 15.86 | 16.36 | 16.86 | 17.38 | 17.91 | 18.47 |
| Fast Moving Consumer Goods | 11.67 | 12.15 | 12.64 | 13.15 | 13.68 | 14.23 | 14.81 | 15.40 | 16.03 | 16.67 | 17.35 |
| Auto Parts | 7.78 | 8.11 | 8.45 | 8.81 | 9.18 | 9.57 | 9.97 | 10.39 | 10.82 | 11.28 | 11.75 |
| Others | 5.84 | 6.05 | 6.28 | 6.51 | 6.75 | 7.00 | 7.26 | 7.53 | 7.81 | 8.09 | 8.39 |
| Region | 2024 | 2025 | 2026 | 2027 | 2028 | 2029 | 2030 | 2031 | 2032 | 2033 | 2034 |
|---|---|---|---|---|---|---|---|---|---|---|---|
| North America | 10.89 | 11.26 | 11.63 | 12.02 | 12.42 | 12.83 | 13.26 | 13.70 | 14.15 | 14.62 | 15.11 |
| Europe | 9.73 | 10.05 | 10.38 | 10.72 | 11.07 | 11.43 | 11.81 | 12.19 | 12.59 | 13.00 | 13.43 |
| Asia Pacific | 13.62 | 14.20 | 14.81 | 15.45 | 16.11 | 16.80 | 17.52 | 18.26 | 19.04 | 19.86 | 20.70 |
| LAMEA | 4.67 | 4.84 | 5.02 | 5.21 | 5.40 | 5.60 | 5.81 | 6.02 | 6.24 | 6.48 | 6.71 |
| Subsegment | 2024 | 2025 | 2026 | 2027 | 2028 | 2029 | 2030 | 2031 | 2032 | 2033 | 2034 |
|---|---|---|---|---|---|---|---|---|---|---|---|
| Preventive Solutions | 21.40 | 22.31 | 23.26 | 24.26 | 25.29 | 26.36 | 27.48 | 28.65 | 29.87 | 31.13 | 32.45 |
| Post-event Solutions | 17.51 | 18.04 | 18.58 | 19.14 | 19.71 | 20.30 | 20.90 | 21.53 | 22.17 | 22.83 | 23.50 |
| Subsegment | 2024 | 2025 | 2026 | 2027 | 2028 | 2029 | 2030 | 2031 | 2032 | 2033 | 2034 |
|---|---|---|---|---|---|---|---|---|---|---|---|
| Electronics | 13.62 | 14.04 | 14.48 | 14.93 | 15.39 | 15.86 | 16.36 | 16.86 | 17.38 | 17.91 | 18.47 |
| Fast Moving Consumer Goods | 11.67 | 12.15 | 12.64 | 13.15 | 13.68 | 14.23 | 14.81 | 15.40 | 16.03 | 16.67 | 17.35 |
| Auto Parts | 7.78 | 8.11 | 8.45 | 8.81 | 9.18 | 9.57 | 9.97 | 10.39 | 10.82 | 11.28 | 11.75 |
| Others | 5.84 | 6.05 | 6.28 | 6.51 | 6.75 | 7.00 | 7.26 | 7.53 | 7.81 | 8.09 | 8.39 |
| Subsegment | 2024 | 2025 | 2026 | 2027 | 2028 | 2029 | 2030 | 2031 | 2032 | 2033 | 2034 |
|---|---|---|---|---|---|---|---|---|---|---|---|
| North America | 10.89 | 11.26 | 11.63 | 12.02 | 12.42 | 12.83 | 13.26 | 13.70 | 14.15 | 14.62 | 15.11 |
| Europe | 9.73 | 10.05 | 10.38 | 10.72 | 11.07 | 11.43 | 11.81 | 12.19 | 12.59 | 13.00 | 13.43 |
| Asia Pacific | 13.62 | 14.20 | 14.81 | 15.45 | 16.11 | 16.80 | 17.52 | 18.26 | 19.04 | 19.86 | 20.70 |
| LAMEA | 4.67 | 4.84 | 5.02 | 5.21 | 5.40 | 5.60 | 5.81 | 6.02 | 6.24 | 6.48 | 6.71 |
To get full access to our Market Insights, you need a Professional Account or a Business Suite.

You will receive an email from our Business Development Manager. Please be sure to check your SPAM/JUNK folder too.

You will receive an email from our Business Development Manager. Please be sure to check your SPAM/JUNK folder too.

Our customers work more efficiently and benefit from


