



Europe Home Healthcare Market (By Type: Device, Services; By Device: Diagnostic & Monitoring Devices, Therapeutic Devices, Home Mobility Assist Devices; By Services: Rehabilitation, Telehealth, Respiratory Therapy, Infusion Therapy, Unskilled Homecare) Industry Size, Share, Growth, Trends 2026 to 2035

The Europe home healthcare market was valued at USD 93.55 million in 2025 and is expected to reach about USD 325.43 million by 2035, growing at a 13.28% CAGR, supported by aging populations, chronic disease management needs, and rising demand for remote care solutions.
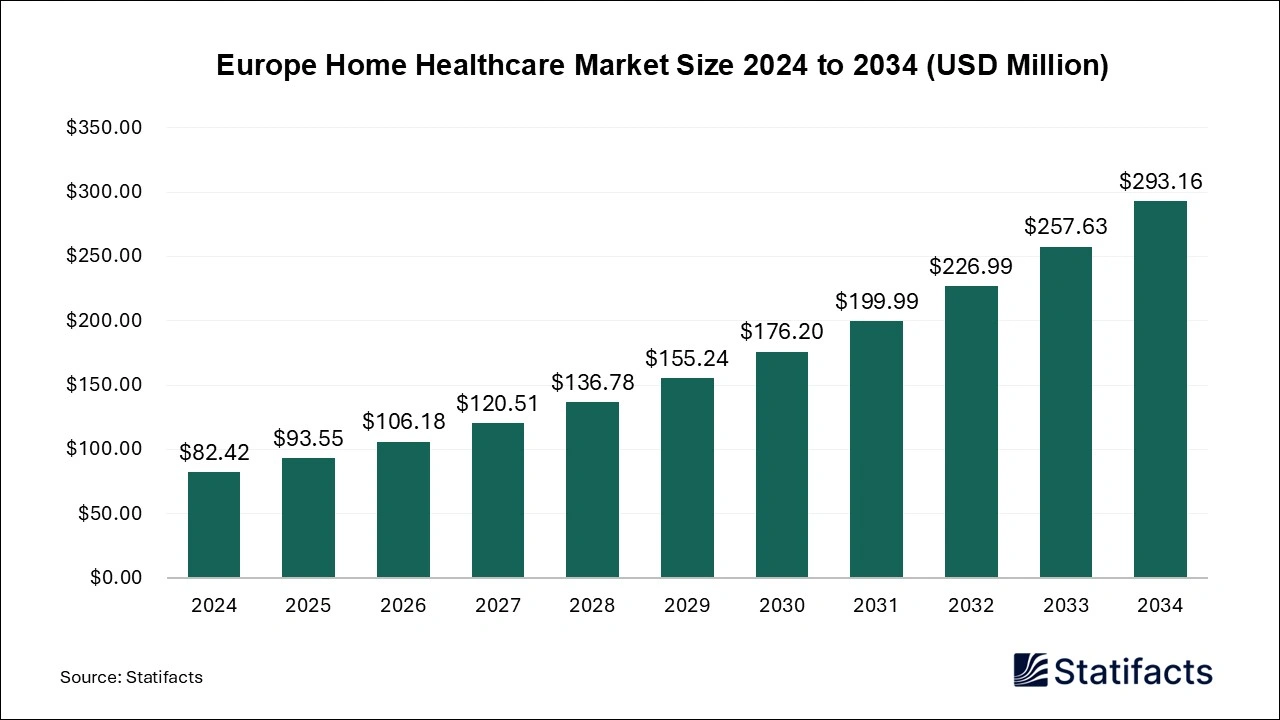
| Reports Attributes | Statistics |
| Market Size in 2025 | USD 93.55 Million |
| Market Size in 2026 | USD 106.18 Million |
| Market Size in 2032 | USD 226.99 Million |
| Market Size by 2035 | USD 325.43 Million |
| CAGR 2026 to 2035 | 13.28% |
| Base Year | 2025 |
| Forecast Period | 2026 to 2035 |
The Europe home healthcare market is gaining momentum as more European countries have aging populations. A report by Euro News stated that the EU population was nearly 449.3 million, with more than one-fifth aged 65 or older. The higher population with elders also possesses a higher risk of various diseases, which requires a higher number of professionals like therapists, nurses, and administrative staff. The major focus of European authorities is to manage hospital bed pressure, which emphasises these home healthcare services for a wider population. Moreover, healthcare costs are higher in most European countries, which drives strong demand for home-based services from the population to manage their finances.
Europe as a region is accelerating significantly in the healthcare sector, with countries advancing through policies and funding. However, the shift towards home healthcare is facing challenges in the current context due to shortages of nurses and therapists who can provide home-based services. Additionally, some rural areas in the country still lack digital infrastructure, which can hamper the growth of remote care and pose several challenges.
The expanding focus on IV therapy, respiratory support, heart-failure diuresis, and other programs is expected to help healthcare organizations attract more attention to remote services from hospitals. The developing countries in the region are also attracting a higher number of immigrants with healthcare degrees, which can help meet the needs of their citizens. The Europe home healthcare market is expected to grow more rapidly, where equipment services are increasing through rental and subscription plans that can manage home healthcare in the region. The growing digitalization in the healthcare sector is also expected to drive further growth, with mobile apps targeting the rural population.
The inclusion of technologies such as artificial intelligence (AI) and Machine Learning (ML) is playing a crucial role in driving the growth of home healthcare in Europe. These technologies are used to analyze patient data from remote sensors in the devices, which can detect health risks and support early intervention. Moreover, these technologies provide detailed dosage tracking and medication reminders, helping engage more patients. The stringent rules from European authorities are expected to help expand mobile-based solutions that guide professionals through several processes, thereby maintaining standardization for companies.
Germany is one of the leading countries in the European home healthcare market, driven by the growing number of older adults seeking long-term home nursing, care assistance, and other services. The German population also has access to home healthcare through long-term insurance and government funds focused on chronic disease management. The increasing government partnerships with the rehab centers are also expected to focus on adopting post-acute rehabs for the companies.
France is one of the most opportunistic countries in the home healthcare market due to the rapid increase in the aging population, which requires constant patient assistance. The country has adopted home hospitalization trends for a long time, which has driven growth through agencies and other service providers. Additionally, the country's digital infrastructure is expected to continue growing through remote ECG decision-making, AI sensors, and more.
| Regions | Shares (%) |
| Simple Generics | 31.73% |
| Super Generics | 68.27% |
| Segments | Shares (%) |
| Pure Generic Drugs | 39.45% |
| Branded Generic Drugs | 60.55% |
| Segments | Shares (%) |
| Oral | 23.96% |
| Injection | 26.82% |
| Cutaneous | 28.11% |
| Others | 28.11% |
| Segments | Shares (%) |
| Central Nervous System (CNS) | 13.18% |
| Cardiovascular | 16.72% |
| Infectious Diseases | 15.08% |
| Musculoskeletal Diseases | 14.94% |
| Respiratory | 13.75% |
| Oncology | 14.64% |
| Others | 11.69% |
| Segments | Shares (%) |
| Retail Pharmacy | 40.12% |
| Hospital Pharmacy | 33.28% |
| Online and Others | 26.60% |
Published by Deepa Pandey





