



Asia Pacific Viral Vectors and Plasmid DNA Manufacturing Market (By Vector Type: Adenovirus, Retrovirus, Adeno-Associated Virus (AAV), Lentivirus, Plasmids, and Others; By Workflow Outlook: Upstream Manufacturing and Downstream Manufacturing; By Application Outlook: Antisense & RNAi Therapy, Gene Therapy, Cell Therapy, Vaccinology, and Research Applications; By End-use Outlook: Pharmaceutical and Biopharmaceutical Companies and Research Institutes; By Disease Outlook: Cancer, Genetic Disorders, Infectious Diseases, and Others) Industry Size, Share, Growth, Trends 2026 to 2035

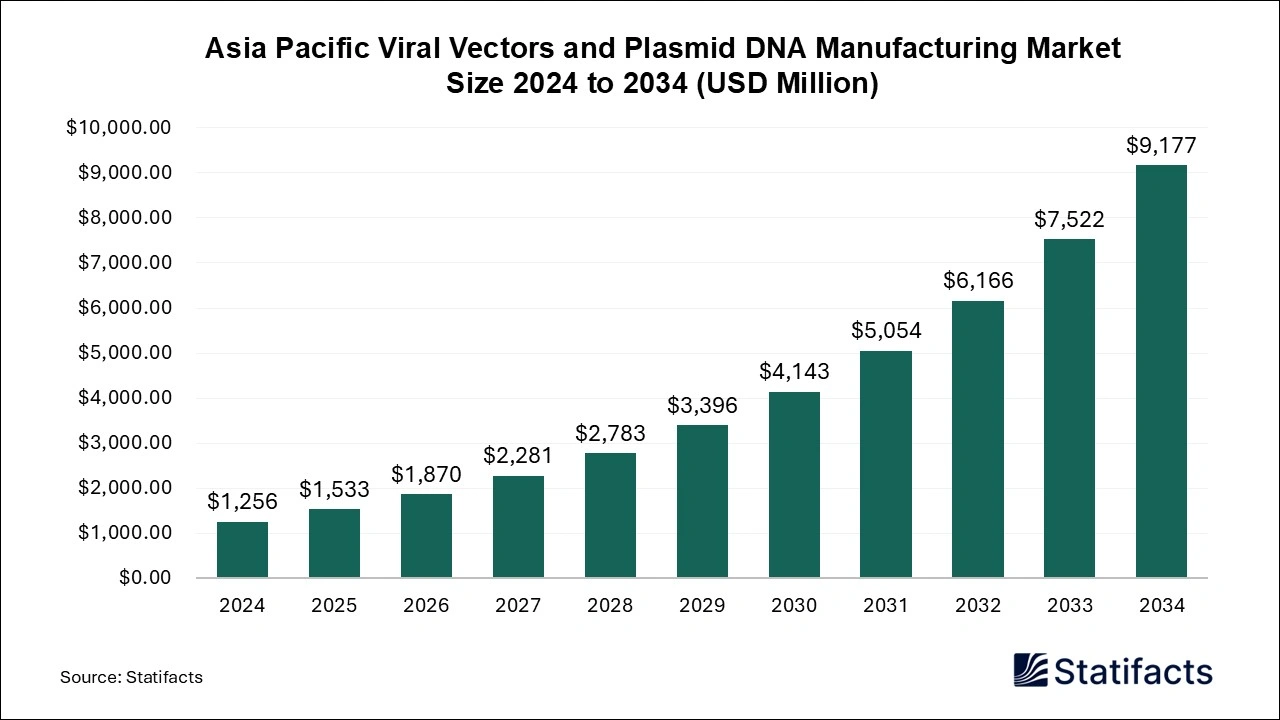
The global viral vectors and plasmid DNA manufacturing market is set for strong expansion, rising from USD 1,533 million in 2025 to nearly USD 10,633 million by 2035, driven by rapid advances in gene therapies and growing biopharma demand.
| Reports Attributes | Statistics |
| Market Size in 2025 | USD 1,533 Million |
| Market Size in 2026 | USD 1,870 Million |
| Market Size in 2032 | USD 6,166 Million |
| Market Size by 2035 | USD 10,633 Million |
| CAGR 2026 to 2035 | 21.37% |
| Base Year | 2025 |
| Forecast Period | 2026 to 2035 |
The Asia Pacific viral vectors and plasmid DNA manufacturing market is gaining momentum, driven by increasing demand for late-stage pipelines for AAV, lentivirus, and other viral vectors used in therapeutics. The market includes the creation of genetic material used in vaccines, gene therapies, and other advanced treatments. The region is witnessing an increasing number of outsourced GMP-grade and CDMO models due to the complexity and regulatory norms. The countries in the region are highly focused on investing in their healthcare infrastructure for drug development. The growing urbanization has led to easier access to technologies across multiple sectors, driven by increasing investments from international and domestic players.
Plasmid DNA and viral vector manufacturing is a challenging, complex process that requires highly skilled professionals and significant capital. Despite rapid growth, the Asia Pacific region struggles with a shortage of skilled personnel who can work on this process. The low standardization of regulatory frameworks across Asian countries is also a restraining factor for companies, as they cannot introduce new products in the region.
The healthcare industry in Asia is highly driven by the increasing focus on strengthening regional CDMOs, which can manage regulations and advance DNA manufacturing. The increasing prevalence of cancer is also a major factor; governments will create more business opportunities for companies involved in developing gene and cell therapies by providing funds for R&D. Moreover, initiatives like the National Biopharma Mission in India are exploring ongoing innovations. The initiative was approved in 2017 with a fund of 1500 crores, co-funded by a World Bank Loan, Which supports over 100 projects and 30 MSMEs.
The integration of technologies such as Artificial Intelligence (AI) and Machine Learning (ML) is playing an influential role in viral vector and plasmid DNA manufacturing in the Asia Pacific. The technology is used to analyze parameters such as feed rates, temperature, pH, and more. more, which helps optimize plasmic yield. The majority of the workflow is driven by AI, which analyzes multiple factors in a shorter period with minimal errors. The bioprocessing equipment is also being monitored by AI to predict failures and reduce downtime.
China is a dominant region in the Asia Pacific for the viral vectors and plasmid DNA manufacturing market, driven by government support for R&D in gene and cell therapies. The country is promoting local players to focus on business, which can help with low-cost manufacturing. As a result, the CDMOs in the country are at a higher rate, which provides services in biologics. Additionally, the country has been able to adopt AI and ML at a lower cost than other countries, which will help its manufacturing process. more effectively.
Japan is a crucial player in the Asia Pacific viral vectors and plasmid DNA manufacturing market due to its well-developed biotechnology base. The country has strong academic research programs, advanced biomanufacturing facilities, and a supportive regulatory environment that encourages innovation in genetic therapies. These strengths allow Japanese firms to maintain high-quality standards and scale production efficiently.
Companies in the region are also expected to improve gene and cell therapies with specialized personnel. Japan has a highly trained workforce in molecular biology and bioprocess engineering, which helps accelerate the development of next-generation therapeutic platforms. This expertise supports faster clinical translation and strengthens the local supply of high-grade viral vectors and plasmid DNA.
| Segments | Shares (%) |
| Adenovirus | 35.58% |
| Retrovirus | 23.81% |
| Adeno-Associated Virus (AAV) | 11.40% |
| Lentivirus | 7.60% |
| Plasmids | 16.81% |
| Others | 4.80% |
| Segments | Shares (%) |
| Upstream Manufacturing | 29.04% |
| Downstream Manufacturing | 70.96% |
| Segments | Shares (%) |
| Antisense & RNAi Therapy | 26.74% |
| Gene Therapy | 44.88% |
| Cell Therapy | 9% |
| Vaccinology | 1.95% |
| Research Applications | 17.43% |
| Segments | Shares (%) |
| Pharmaceutical and Biopharmaceutical Companies | 16.59% |
| Research Institutes | 83.41% |
| Segments | Shares (%) |
| Cancer | 16.86% |
| Genetic Disorders | 41.72% |
| Infectious Diseases | 25.80% |
| Others | 15.62% |
Published by Ajit Bansod





