By clicking “Accept All Cookies” you agree to the storing of cookies on your device to enhance site navigation, analyze site usage, and assist in our marketing efforts.
Privacy PolicyGlobal Power Module Packaging Market (By Type: SiC MOSFET Module, IGBT Module, Intelligent Power Module (IPM); By Application: Automotive & EV/HEV, Industrial Control, Consumer Appliances, Wind Power, PV, Energy Storage, Traction, Military & Avionics, Others; By Region: North America, Europe, Asia-Pacific, Latin America, Middle East and Africa) Industry Size, Share, Growth, Trends 2025 to 2034.
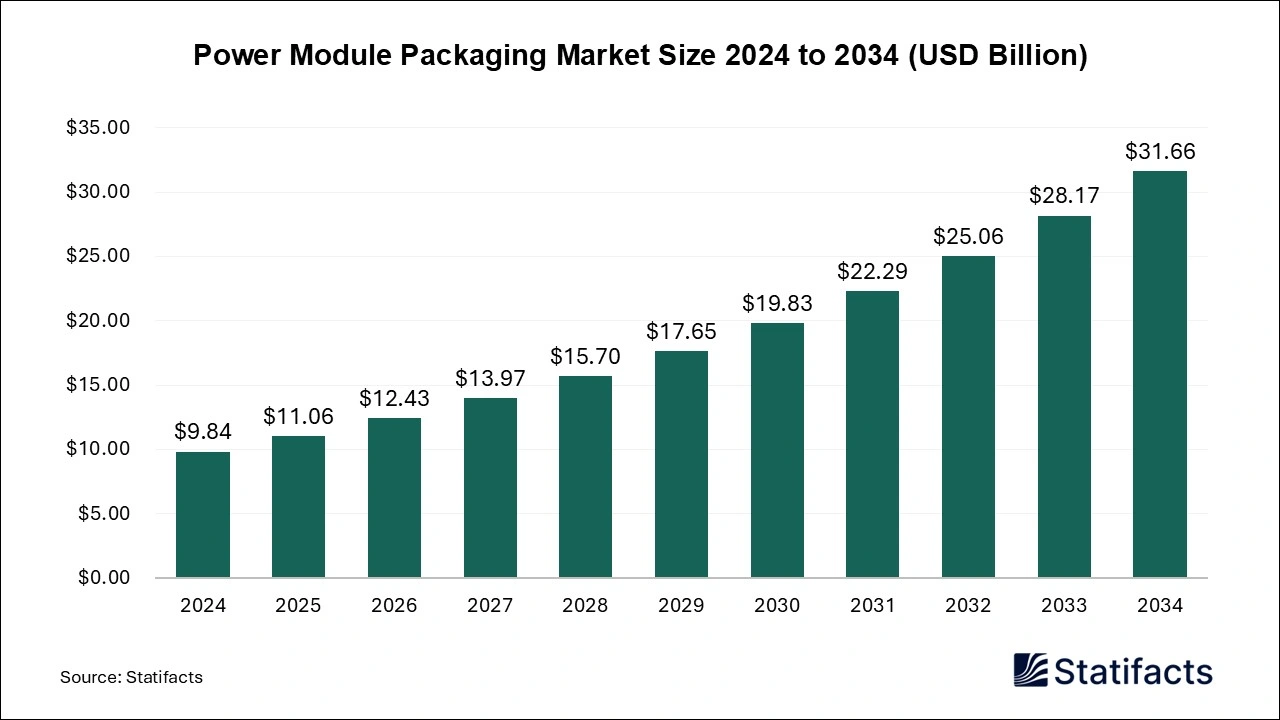
The global power module packaging market, valued at USD 9.84 billion in 2024, is projected to reach USD 31.66 billion by 2034, growing at a CAGR of 12.4% driven by the rise of electric vehicles, renewable energy systems, and high-efficiency power electronics.
| Reports Attributes | Statistics |
| Market Size in 2024 | USD 9.84 Billion |
| Market Size in 2025 | USD 11.06 Billion |
| Market Size in 2031 | USD 22.29 Billion |
| Market Size by 2034 | USD 31.66 Billion |
| CAGR 2025 to 2034 | 12.4% |
| Base Year | 2024 |
| Forecast Period | 2025 to 2034 |
The power module packaging market is gaining momentum, driven by the rapid adoption of electric vehicles (EVs), which require high-performance modules in both chargers and powertrains. At the same time, renewable energy inverters are creating additional demand for compact, high-power modules that support energy efficiency. The transition toward advanced semiconductor materials such as silicon carbide (SiC) and gallium nitride (GaN) is also reshaping the industry, as these materials enable smaller, faster, and more reliable power systems. The expansion of data centers and AI-driven computing workloads further amplifies demand for robust packaging solutions that ensure higher performance and reliability.
However, the market faces cost-related challenges. Advanced packaging materials remain expensive, which may slow adoption in less developed economies. Even so, opportunities are emerging from the growing electrification of transportation, the deployment of renewable energy, and the increasing need for efficient power management in cloud and AI infrastructure. These trends are expected to sustain long-term growth and create new revenue opportunities for market participants.
Artificial intelligence (AI) and machine learning (ML) are transforming packaging design and testing in this sector. ML algorithms are being applied to optimize layouts and improve manufacturing yields, while AI tools are increasingly used to predict fatigue and aging in power modules through advanced simulations. By enabling predictive maintenance and design optimization, AI is enhancing both the reliability and cost efficiency of power module packaging, thereby accelerating innovation across the industry.
| Regions | Shares (%) |
| North America | 23% |
| Asia Pacific | 46% |
| Europe | 26% |
| Latin America | 3% |
| Middle East & Africa | 2% |
| Segments | Shares (%) |
| SiC MOSFET Module | 26% |
| IGBT Module | 60% |
| Intelligent Power Module (IPM) | 14% |
| Segments | Shares (%) |
| Automotive & EV/HEV | 28% |
| Industrial Control | 22% |
| Consumer Appliances | 14% |
| Wind power, PV, Energy Storage | 18% |
| Traction | 9% |
| Military & Avionics | 4% |
| Others | 5% |
Published by Shubham Desale
| Type | 2024 | 2025 | 2026 | 2027 | 2028 | 2029 | 2030 | 2031 | 2032 | 2033 | 2034 |
|---|---|---|---|---|---|---|---|---|---|---|---|
| SiC MOSFET Module | 2.56 | 3.03 | 3.58 | 4.22 | 4.96 | 5.83 | 6.83 | 7.98 | 9.33 | 10.88 | 12.67 |
| IGBT Module | 5.90 | 6.50 | 7.16 | 7.88 | 8.67 | 9.53 | 10.48 | 11.51 | 12.63 | 13.86 | 15.20 |
| Intelligent Power Module (IPM) | 1.38 | 1.53 | 1.69 | 1.87 | 2.08 | 2.29 | 2.53 | 2.81 | 3.11 | 3.44 | 3.80 |
| Application | 2024 | 2025 | 2026 | 2027 | 2028 | 2029 | 2030 | 2031 | 2032 | 2033 | 2034 |
|---|---|---|---|---|---|---|---|---|---|---|---|
| Automotive & EV/HEV | 2.76 | 3.17 | 3.65 | 4.21 | 4.84 | 5.56 | 6.39 | 7.34 | 8.42 | 9.66 | 11.08 |
| Industrial Control | 2.16 | 2.42 | 2.71 | 3.03 | 3.39 | 3.80 | 4.25 | 4.75 | 5.31 | 5.95 | 6.65 |
| Consumer Appliances | 1.38 | 1.52 | 1.67 | 1.83 | 2.01 | 2.21 | 2.42 | 2.65 | 2.91 | 3.18 | 3.48 |
| Wind power, PV, Energy Storage | 1.77 | 2.01 | 2.29 | 2.60 | 2.95 | 3.35 | 3.81 | 4.33 | 4.91 | 5.58 | 6.33 |
| Traction | 0.89 | 0.98 | 1.09 | 1.22 | 1.35 | 1.50 | 1.67 | 1.85 | 2.06 | 2.28 | 2.53 |
| Military & Avionics | 0.39 | 0.44 | 0.48 | 0.54 | 0.60 | 0.66 | 0.73 | 0.81 | 0.90 | 1 | 1.11 |
| Others | 0.49 | 0.52 | 0.54 | 0.54 | 0.57 | 0.57 | 0.57 | 0.57 | 0.56 | 0.53 | 0.49 |
| Region | 2024 | 2025 | 2026 | 2027 | 2028 | 2029 | 2030 | 2031 | 2032 | 2033 | 2034 |
|---|---|---|---|---|---|---|---|---|---|---|---|
| North America | 2.26 | 2.53 | 2.83 | 3.17 | 3.55 | 3.97 | 4.44 | 4.97 | 5.57 | 6.23 | 6.97 |
| Europe | 2.56 | 2.86 | 3.21 | 3.59 | 4.02 | 4.50 | 5.04 | 5.64 | 6.32 | 7.07 | 7.92 |
| Asia-Pacific | 4.53 | 5.11 | 5.77 | 6.51 | 7.35 | 8.30 | 9.37 | 10.57 | 11.93 | 13.47 | 15.20 |
| Latin America | 0.30 | 0.33 | 0.37 | 0.42 | 0.47 | 0.53 | 0.60 | 0.67 | 0.75 | 0.85 | 0.95 |
| Middle East and Africa | 0.19 | 0.23 | 0.25 | 0.28 | 0.32 | 0.35 | 0.39 | 0.45 | 0.50 | 0.56 | 0.63 |
| Subsegment | 2024 | 2025 | 2026 | 2027 | 2028 | 2029 | 2030 | 2031 | 2032 | 2033 | 2034 |
|---|---|---|---|---|---|---|---|---|---|---|---|
| SiC MOSFET Module | 2.56 | 3.03 | 3.58 | 4.22 | 4.96 | 5.83 | 6.83 | 7.98 | 9.33 | 10.88 | 12.67 |
| IGBT Module | 5.90 | 6.50 | 7.16 | 7.88 | 8.67 | 9.53 | 10.48 | 11.51 | 12.63 | 13.86 | 15.20 |
| Intelligent Power Module (IPM) | 1.38 | 1.53 | 1.69 | 1.87 | 2.08 | 2.29 | 2.53 | 2.81 | 3.11 | 3.44 | 3.80 |
| Subsegment | 2024 | 2025 | 2026 | 2027 | 2028 | 2029 | 2030 | 2031 | 2032 | 2033 | 2034 |
|---|---|---|---|---|---|---|---|---|---|---|---|
| Automotive & EV/HEV | 2.76 | 3.17 | 3.65 | 4.21 | 4.84 | 5.56 | 6.39 | 7.34 | 8.42 | 9.66 | 11.08 |
| Industrial Control | 2.16 | 2.42 | 2.71 | 3.03 | 3.39 | 3.80 | 4.25 | 4.75 | 5.31 | 5.95 | 6.65 |
| Consumer Appliances | 1.38 | 1.52 | 1.67 | 1.83 | 2.01 | 2.21 | 2.42 | 2.65 | 2.91 | 3.18 | 3.48 |
| Wind power, PV, Energy Storage | 1.77 | 2.01 | 2.29 | 2.60 | 2.95 | 3.35 | 3.81 | 4.33 | 4.91 | 5.58 | 6.33 |
| Traction | 0.89 | 0.98 | 1.09 | 1.22 | 1.35 | 1.50 | 1.67 | 1.85 | 2.06 | 2.28 | 2.53 |
| Military & Avionics | 0.39 | 0.44 | 0.48 | 0.54 | 0.60 | 0.66 | 0.73 | 0.81 | 0.90 | 1 | 1.11 |
| Others | 0.49 | 0.52 | 0.54 | 0.54 | 0.57 | 0.57 | 0.57 | 0.57 | 0.56 | 0.53 | 0.49 |
| Subsegment | 2024 | 2025 | 2026 | 2027 | 2028 | 2029 | 2030 | 2031 | 2032 | 2033 | 2034 |
|---|---|---|---|---|---|---|---|---|---|---|---|
| North America | 2.26 | 2.53 | 2.83 | 3.17 | 3.55 | 3.97 | 4.44 | 4.97 | 5.57 | 6.23 | 6.97 |
| Europe | 2.56 | 2.86 | 3.21 | 3.59 | 4.02 | 4.50 | 5.04 | 5.64 | 6.32 | 7.07 | 7.92 |
| Asia-Pacific | 4.53 | 5.11 | 5.77 | 6.51 | 7.35 | 8.30 | 9.37 | 10.57 | 11.93 | 13.47 | 15.20 |
| Latin America | 0.30 | 0.33 | 0.37 | 0.42 | 0.47 | 0.53 | 0.60 | 0.67 | 0.75 | 0.85 | 0.95 |
| Middle East and Africa | 0.19 | 0.23 | 0.25 | 0.28 | 0.32 | 0.35 | 0.39 | 0.45 | 0.50 | 0.56 | 0.63 |
To get full access to our Market Insights, you need a Professional Account or a Business Suite.

You will receive an email from our Business Development Manager. Please be sure to check your SPAM/JUNK folder too.

You will receive an email from our Business Development Manager. Please be sure to check your SPAM/JUNK folder too.

Our customers work more efficiently and benefit from


