

Livestock Diagnostics Market (By Product: Consumables, Reagents & Kits, Equipment & Instruments; By Animal: Cattle, Poultry, Swine, Other Livestock Animals; By Testing Category: Clinical Chemistry, Microbiology, Parasitology, Histopathology, Cytopathology, Hematology, Immunology & Serology, Imaging, Molecular Diagnostics, Other Categories; By End Use: Reference Laboratories, Veterinarians, Animal Owners/Producers; By Region: North America, LAMEA, Europe, Asia-Pacific) Industry Size, Share, Growth, Trends 2026 to 2035.

The global livestock diagnostics market was valued at USD 3.42 billion in 2025 and is projected to reach USD 10.25 billion by 2035, growing at a robust CAGR of 11.60%. This growth is driven by advancements in diagnostic technology and rising demand for animal health monitoring globally.
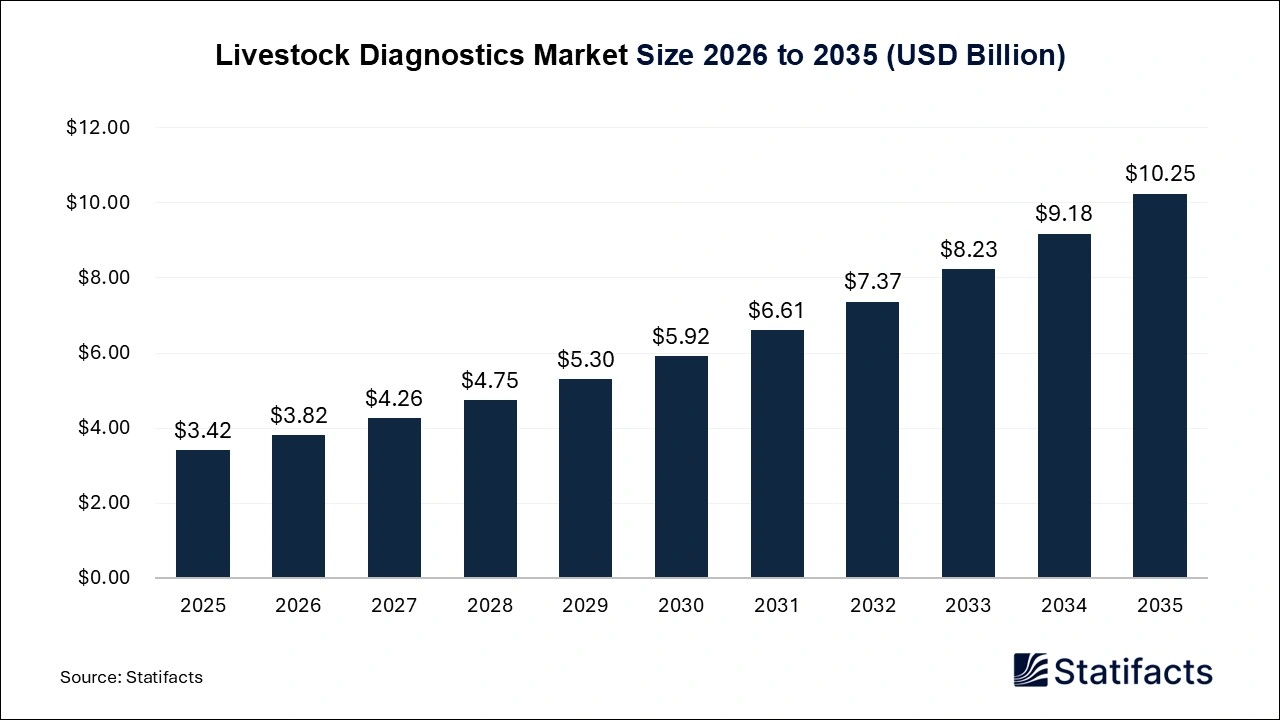
| Reports Attributes | Statistics |
| Market Size in 2025 | USD 3.42 Billion |
| Market Size in 2026 | USD 3.82 Billion |
| Market Size in 2032 | USD 7.37 Billion |
| Market Size by 2035 | USD 10.25 Billion |
| CAGR 2026 to 2035 | 11.60% |
| Base Year | 2025 |
| Forecast Period | 2026 to 2035 |
The livestock diagnostics consist of various methods, processes, and technologies addressing any infection in poultry, swine, or other cattle and registering the health status of the same. The robust modern testing technologies, such as parasitology, molecular diagnostics, and immunodiagnostics, are unlocking new methods and pathways to benefit the livestock diagnostics market. The livestock diagnostics are implemented for general applications like POC testing, accurate monitoring, and reproductive management.
With the help of artificial intelligence-inspired cameras and wearable sensor technology, it records animal temperature, feeding patterns, and activities. Livestock’s good health is important for public health, and the adoption of livestock diagnostics has somewhat reduced the use of antibiotics. Given the seriousness of food safety and to control the expansion of zoonotic conditions, the market has taken centre stage to promote modern agriculture and strengthen the growth of the market.
| Regions | Shares (%) |
| North America | 25% |
| Europe | 30% |
| Asia Pacific | 30% |
| LAMEA | 15% |
| Segments | Shares (%) |
| Consumables, Reagents & Kits | 60% |
| Equipment & Instruments | 40% |
| Segments | Shares (%) |
| Cattle | 40% |
| Poultry | 30% |
| Swine | 20% |
| Other Livestock Animals | 10% |
| Segments | Shares (%) |
| Reference Laboratories | 40% |
| Veterinarians | 30% |
| Animal Owners/Producers | 30% |
Published by Ajit Bansod

| Product | 2025 | 2026 | 2027 | 2028 | 2029 | 2030 | 2031 | 2032 | 2033 | 2034 | 2035 |
|---|---|---|---|---|---|---|---|---|---|---|---|
| Consumables, Reagents & Kits | 2.05 | 2.24 | 2.51 | 2.81 | 3.05 | 3.39 | 3.66 | 4.17 | 4.67 | 5.17 | 5.81 |
| Equipment & Instruments | 1.37 | 1.58 | 1.75 | 1.94 | 2.25 | 2.53 | 2.95 | 3.20 | 3.56 | 4.01 | 4.44 |
| End Use | 2025 | 2026 | 2027 | 2028 | 2029 | 2030 | 2031 | 2032 | 2033 | 2034 | 2035 |
|---|---|---|---|---|---|---|---|---|---|---|---|
| Reference Laboratories | 1.37 | 1.50 | 1.68 | 1.91 | 2.17 | 2.44 | 2.67 | 3.11 | 3.29 | 3.55 | 4.01 |
| Veterinarians | 1.03 | 1.16 | 1.23 | 1.36 | 1.57 | 1.69 | 1.96 | 2.09 | 2.43 | 2.74 | 3.10 |
| Animal Owners/ Producers | 1.03 | 1.16 | 1.35 | 1.48 | 1.56 | 1.78 | 1.98 | 2.17 | 2.51 | 2.89 | 3.14 |
| Region | 2025 | 2026 | 2027 | 2028 | 2029 | 2030 | 2031 | 2032 | 2033 | 2034 | 2035 |
|---|---|---|---|---|---|---|---|---|---|---|---|
| North America | 0.86 | 0.87 | 0.94 | 1.10 | 1.17 | 1.27 | 1.42 | 1.65 | 1.83 | 1.98 | 2.32 |
| Europe | 1.03 | 1.18 | 1.28 | 1.45 | 1.73 | 2.06 | 2.34 | 2.53 | 2.85 | 3.27 | 3.48 |
| Asia Pacific | 1.03 | 1.18 | 1.34 | 1.50 | 1.72 | 1.88 | 2.13 | 2.32 | 2.57 | 2.90 | 3.28 |
| LAMEA | 0.51 | 0.58 | 0.71 | 0.70 | 0.68 | 0.71 | 0.72 | 0.88 | 0.97 | 1.03 | 1.17 |
| Subsegment | 2025 | 2026 | 2027 | 2028 | 2029 | 2030 | 2031 | 2032 | 2033 | 2034 | 2035 |
|---|---|---|---|---|---|---|---|---|---|---|---|
| Consumables, Reagents & Kits | 2.05 | 2.24 | 2.51 | 2.81 | 3.05 | 3.39 | 3.66 | 4.17 | 4.67 | 5.17 | 5.81 |
| Equipment & Instruments | 1.37 | 1.58 | 1.75 | 1.94 | 2.25 | 2.53 | 2.95 | 3.20 | 3.56 | 4.01 | 4.44 |
| Subsegment | 2025 | 2026 | 2027 | 2028 | 2029 | 2030 | 2031 | 2032 | 2033 | 2034 | 2035 |
|---|---|---|---|---|---|---|---|---|---|---|---|
| Reference Laboratories | 1.37 | 1.50 | 1.68 | 1.91 | 2.17 | 2.44 | 2.67 | 3.11 | 3.29 | 3.55 | 4.01 |
| Veterinarians | 1.03 | 1.16 | 1.23 | 1.36 | 1.57 | 1.69 | 1.96 | 2.09 | 2.43 | 2.74 | 3.10 |
| Animal Owners/ Producers | 1.03 | 1.16 | 1.35 | 1.48 | 1.56 | 1.78 | 1.98 | 2.17 | 2.51 | 2.89 | 3.14 |
| Subsegment | 2025 | 2026 | 2027 | 2028 | 2029 | 2030 | 2031 | 2032 | 2033 | 2034 | 2035 |
|---|---|---|---|---|---|---|---|---|---|---|---|
| North America | 0.86 | 0.87 | 0.94 | 1.10 | 1.17 | 1.27 | 1.42 | 1.65 | 1.83 | 1.98 | 2.32 |
| Europe | 1.03 | 1.18 | 1.28 | 1.45 | 1.73 | 2.06 | 2.34 | 2.53 | 2.85 | 3.27 | 3.48 |
| Asia Pacific | 1.03 | 1.18 | 1.34 | 1.50 | 1.72 | 1.88 | 2.13 | 2.32 | 2.57 | 2.90 | 3.28 |
| LAMEA | 0.51 | 0.58 | 0.71 | 0.70 | 0.68 | 0.71 | 0.72 | 0.88 | 0.97 | 1.03 | 1.17 |
To get full access to our Market Insights, you need a Professional Account or a Business Suite.
You will receive an email from our Business Development Manager. Please be sure to check your SPAM/JUNK folder too.
Our customers work more efficiently and benefit from

