By clicking “Accept All Cookies” you agree to the storing of cookies on your device to enhance site navigation, analyze site usage, and assist in our marketing efforts.
Privacy PolicyCardiovascular Sonography System Market (By Type: Desktop, Portable, Handheld; By Application: Hospital, Clinic, Independent Imaging Center; By Region: North America, Asia-Pacific, Latin America, Middle East and Africa) Industry Size, Share, Growth, Trends 2025 to 2034.
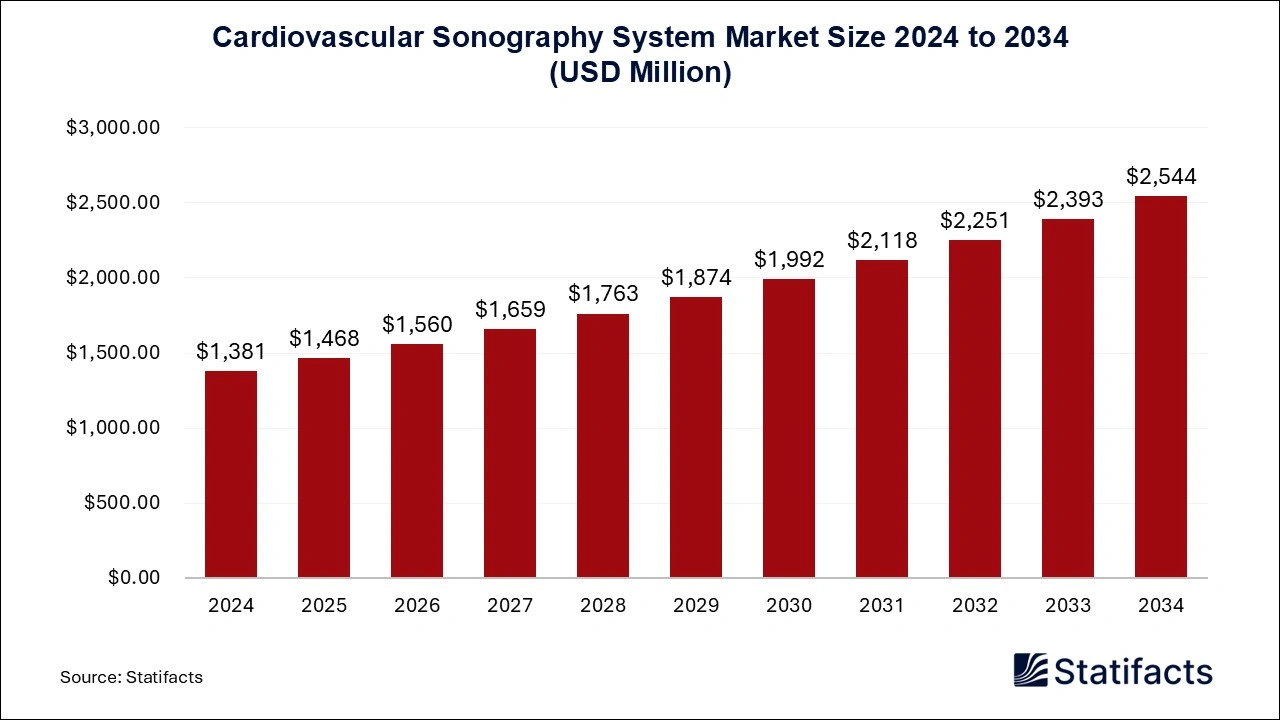
The global cardiovascular sonography system market, valued at USD 1,381 million in 2024, is projected to reach USD 2,544 million by 2034, growing at a CAGR of 6.3% driven by the increasing adoption of non-invasive diagnostic technologies in heart health monitoring.
| Reports Attributes | Statistics |
| Market Size in 2024 | USD 1,381 Million |
| Market Size in 2025 | USD 1,468 Million |
| Market Size in 2031 | USD 2,118 Million |
| Market Size by 2034 | USD 2,544 Million |
| CAGR 2025 to 2034 | 6.3% |
| Base Year | 2024 |
| Forecast Period | 2025 to 2034 |
The cardiovascular sonography system market is gaining popularity, driven by the rising aging population, which creates a need for cardiac care. As a result, healthcare organizations are focused on investing in monitoring and screening devices that can help meet the growing healthcare demand. The lower healthcare budget in the government hospitals in rural areas may limit its adoption in these healthcare settings. Moreover, these systems also require a skilled workforce to operate them, which stands as a barrier to growth.
The rapid investments in emerging countries, such as China, India, South Korea, and Japan, are expected to play a transformative role in the growth of the cardiovascular sonography system market. These areas are witnessing a rapid rise in private healthcare organizations, which attract business opportunities for new players. The integration of artificial intelligence (AI) is significantly guiding the growth in the industry, as it helps in various parameters, including automated image acquisition assistance, measurements, and structured reporting.
| Regions | Shares (%) |
| North America | 40% |
| Asia Pacific | 40% |
| Europe | 28% |
| Latin America | 4% |
| Middle East & Africa | 3% |
| Segments | Shares (%) |
| Desktop | 40% |
| Portable | 35% |
| Handheld | 25% |
| Segments | Shares (%) |
| Hospital | 50% |
| Clinic | 30% |
| Independent Imaging Center | 20% |
Published by Kesiya Chacko
| Type | 2024 | 2025 | 2026 | 2027 | 2028 | 2029 | 2030 | 2031 | 2032 | 2033 | 2034 |
|---|---|---|---|---|---|---|---|---|---|---|---|
| Desktop | 552.40 | 584.27 | 617.95 | 653.57 | 691.21 | 731.01 | 773.08 | 817.55 | 864.55 | 914.23 | 966.74 |
| Portable | 483.35 | 516.74 | 552.41 | 590.53 | 631.26 | 674.78 | 721.28 | 770.95 | 824.03 | 880.73 | 941.30 |
| Handheld | 345.25 | 366.99 | 390.13 | 414.70 | 440.83 | 468.60 | 498.12 | 529.50 | 562.86 | 598.32 | 636.01 |
| Application | 2024 | 2025 | 2026 | 2027 | 2028 | 2029 | 2030 | 2031 | 2032 | 2033 | 2034 |
|---|---|---|---|---|---|---|---|---|---|---|---|
| Hospital | 690.50 | 736.94 | 786.49 | 839.35 | 895.76 | 955.94 | 1,020.15 | 1,088.65 | 1,161.74 | 1,239.72 | 1,322.91 |
| Clinic | 414.30 | 437.46 | 461.90 | 487.69 | 514.88 | 543.57 | 573.83 | 605.75 | 639.41 | 674.90 | 712.34 |
| Independent Imaging Center | 276.20 | 293.60 | 312.10 | 331.76 | 352.66 | 374.88 | 398.50 | 423.60 | 450.29 | 478.66 | 508.80 |
| Region | 2024 | 2025 | 2026 | 2027 | 2028 | 2029 | 2030 | 2031 | 2032 | 2033 | 2034 |
|---|---|---|---|---|---|---|---|---|---|---|---|
| North America | 414.30 | 438.49 | 464.10 | 491.19 | 519.86 | 550.19 | 582.29 | 616.26 | 652.20 | 690.23 | 730.47 |
| Europe | 386.68 | 409.16 | 432.95 | 458.11 | 484.73 | 512.89 | 542.68 | 574.20 | 607.53 | 642.79 | 680.09 |
| Asia-Pacific | 483.35 | 517.69 | 554.42 | 593.73 | 635.77 | 680.75 | 728.86 | 780.32 | 835.35 | 894.22 | 957.17 |
| Latin America | 55.24 | 58.66 | 62.29 | 66.15 | 70.25 | 74.60 | 79.22 | 84.13 | 89.34 | 94.88 | 100.75 |
| Middle East and Africa | 41.43 | 44 | 46.73 | 49.62 | 52.69 | 55.96 | 59.43 | 63.09 | 67.02 | 71.16 | 75.57 |
| Subsegment | 2024 | 2025 | 2026 | 2027 | 2028 | 2029 | 2030 | 2031 | 2032 | 2033 | 2034 |
|---|---|---|---|---|---|---|---|---|---|---|---|
| Desktop | 552.40 | 584.27 | 617.95 | 653.57 | 691.21 | 731.01 | 773.08 | 817.55 | 864.55 | 914.23 | 966.74 |
| Portable | 483.35 | 516.74 | 552.41 | 590.53 | 631.26 | 674.78 | 721.28 | 770.95 | 824.03 | 880.73 | 941.30 |
| Handheld | 345.25 | 366.99 | 390.13 | 414.70 | 440.83 | 468.60 | 498.12 | 529.50 | 562.86 | 598.32 | 636.01 |
| Subsegment | 2024 | 2025 | 2026 | 2027 | 2028 | 2029 | 2030 | 2031 | 2032 | 2033 | 2034 |
|---|---|---|---|---|---|---|---|---|---|---|---|
| Hospital | 690.50 | 736.94 | 786.49 | 839.35 | 895.76 | 955.94 | 1,020.15 | 1,088.65 | 1,161.74 | 1,239.72 | 1,322.91 |
| Clinic | 414.30 | 437.46 | 461.90 | 487.69 | 514.88 | 543.57 | 573.83 | 605.75 | 639.41 | 674.90 | 712.34 |
| Independent Imaging Center | 276.20 | 293.60 | 312.10 | 331.76 | 352.66 | 374.88 | 398.50 | 423.60 | 450.29 | 478.66 | 508.80 |
| Subsegment | 2024 | 2025 | 2026 | 2027 | 2028 | 2029 | 2030 | 2031 | 2032 | 2033 | 2034 |
|---|---|---|---|---|---|---|---|---|---|---|---|
| North America | 414.30 | 438.49 | 464.10 | 491.19 | 519.86 | 550.19 | 582.29 | 616.26 | 652.20 | 690.23 | 730.47 |
| Europe | 386.68 | 409.16 | 432.95 | 458.11 | 484.73 | 512.89 | 542.68 | 574.20 | 607.53 | 642.79 | 680.09 |
| Asia-Pacific | 483.35 | 517.69 | 554.42 | 593.73 | 635.77 | 680.75 | 728.86 | 780.32 | 835.35 | 894.22 | 957.17 |
| Latin America | 55.24 | 58.66 | 62.29 | 66.15 | 70.25 | 74.60 | 79.22 | 84.13 | 89.34 | 94.88 | 100.75 |
| Middle East and Africa | 41.43 | 44 | 46.73 | 49.62 | 52.69 | 55.96 | 59.43 | 63.09 | 67.02 | 71.16 | 75.57 |
To get full access to our Market Insights, you need a Professional Account or a Business Suite.

You will receive an email from our Business Development Manager. Please be sure to check your SPAM/JUNK folder too.

You will receive an email from our Business Development Manager. Please be sure to check your SPAM/JUNK folder too.

Our customers work more efficiently and benefit from


